Note
Go to the end to download the full example code.
Fill area between curves
The pygmt.Figure.fill_between method fills the area between two curves y1 and
y2. Different fills (colors or patterns) can be used for the areas y1 > y2 and
y1 < y2. Optionally, the curves can be drawn.
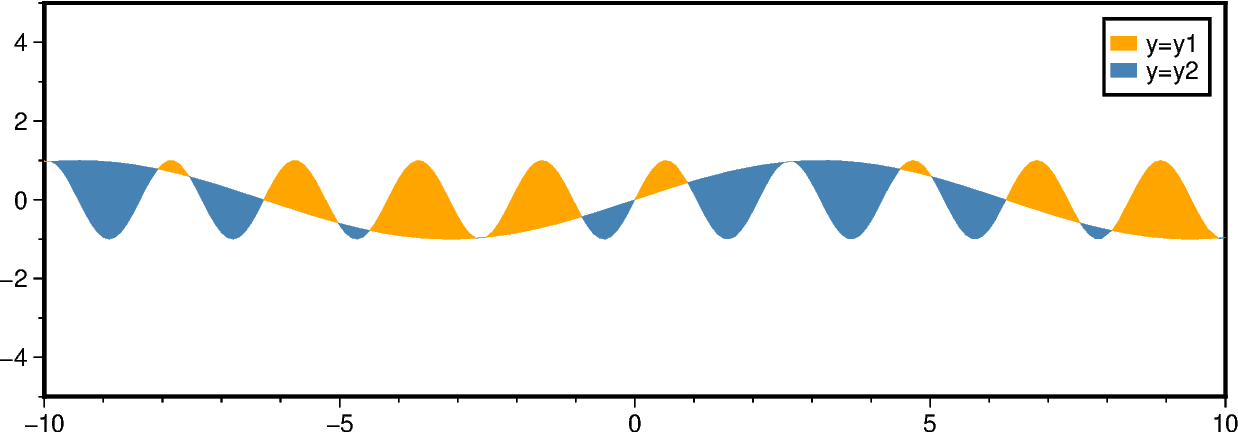
Fill the areas between the two curves. Use the fill and fill2 parameters to
set different fills for areas with y1 > y2 and y1 < y2, respectively. Use the
label and label2 parameters to set the corresponding legend entries.
fig = pygmt.Figure()
fig.basemap(region=[-10, 10, -5, 5], projection="X15c/5c", frame=True)

fig.fill_between(
    x=x, y=y1, y2=y2, fill="orange", fill2="steelblue", label="y=y1", label2="y=y2"
)
fig.legend()
fig.show()
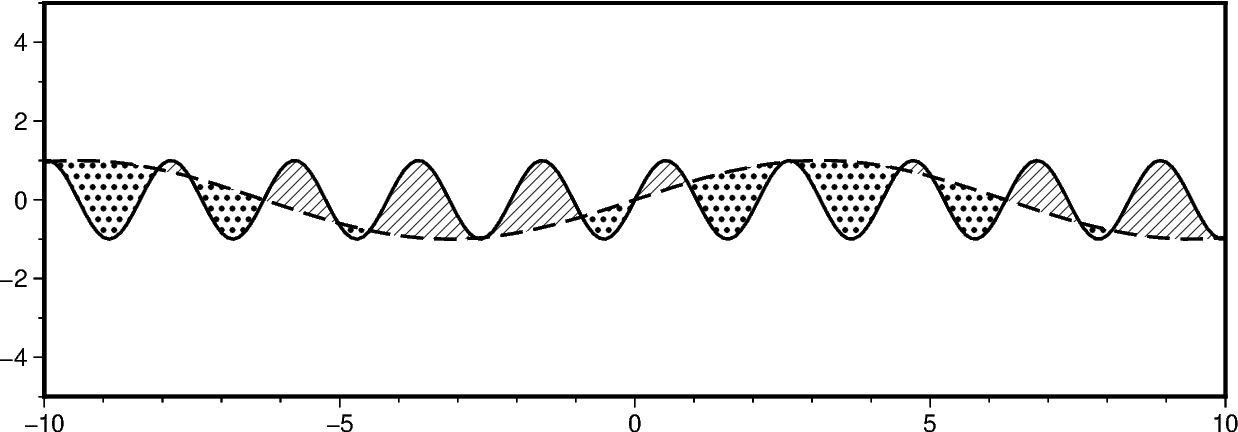
In addition to filling the areas, we can draw the curves. Use the pen and
pen2 parameters to set different lines for the two curves y1 and y2, respectively.
fig = pygmt.Figure()
fig.basemap(region=[-10, 10, -5, 5], projection="X15c/5c", frame=True)
fig.fill_between(
    x=x,
    y=y1,
    y2=y2,
    fill="p8",
    fill2="p17",
    pen="1p,black,solid",
    pen2="1p,black,dashed",
)
fig.show()
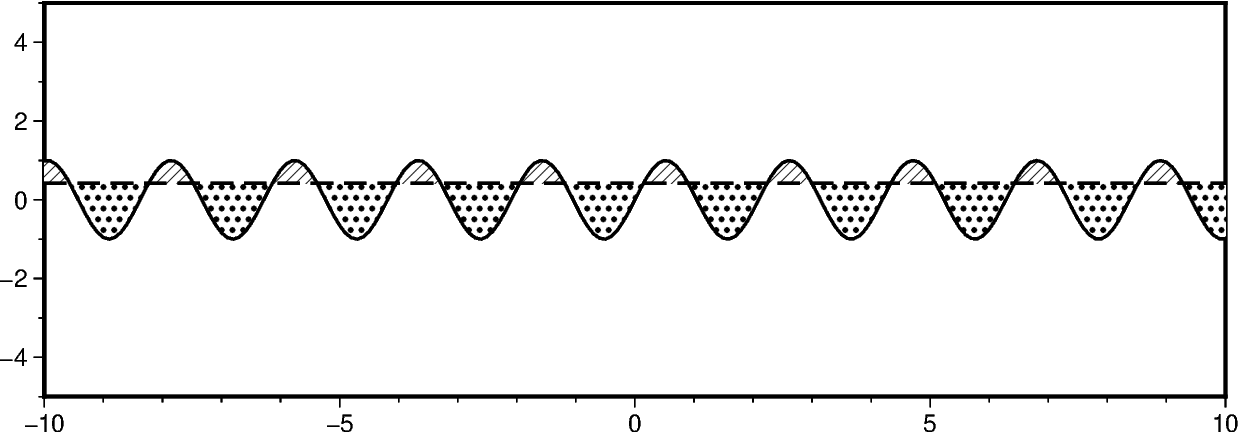
To compare a curve y1 to a horizontal line, pass the desired y-level to y2.
fig = pygmt.Figure()
fig.basemap(region=[-10, 10, -5, 5], projection="X15c/5c", frame=True)

fig.fill_between(
    x=x,
    y=y1,
    y2=0.42,
    fill="p8",
    fill2="p17",
    pen="1p,black,solid",
    pen2="1p,black,dashed",
)
fig.show()
Total running time of the script: (0 minutes 0.395 seconds)